Codex SQLite Log Bug Explained: 640TB SSD Writes, TRACE Logs, and OpenAI Fixes
A clear explanation of the Codex SQLite feedback log bug, why a small local log database could still generate massive SSD writes, how TRACE logging and SQLite WAL amplified the issue, and what fixes were merged.
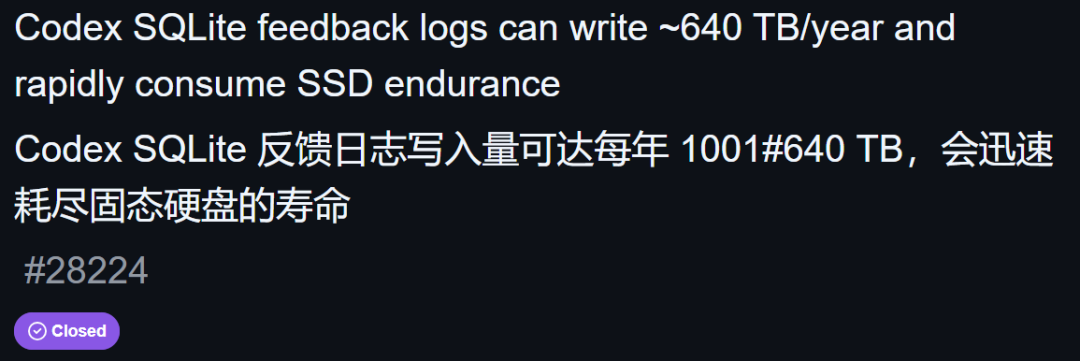
A recent Codex logging issue turned a quiet local database into a surprisingly heavy SSD writer. According to the original GitHub report, Codex’s SQLite feedback logs could write roughly 640TB per year under the reported usage pattern. For a consumer SSD rated around 600TBW, that number is not just a little messy; it is close to the drive’s warranted write endurance.
The strange part is that the log database did not look huge. The file could sit around one gigabyte, while the actual historical writes kept piling up in the background. That is why this bug attracted so much attention: it did not fill the disk in an obvious way, but it could still burn through write cycles.
Source note: This article is based on the BAAI Hub repost of Xinzhiyuan’s report and cross-checked with the public GitHub issue and Hacker News discussion. Brand logos, QR codes, follow prompts, and unrelated decorative images from the original page were not included.
How 640TB of SSD Writes Can Happen
The number sounds exaggerated at first, so it helps to start with the measurement.
In the GitHub issue, the reporter said that after about 21 days of uptime, the main SSD had written around 37TB. When extrapolated to a full year, that becomes roughly 640TB. The suspected main source was Codex’s local SQLite feedback log database.
Codex was writing to files under the local configuration directory:
~/.codex/logs_2.sqlite
~/.codex/logs_2.sqlite-wal
~/.codex/logs_2.sqlite-shm
The behavior was not simply “the log file keeps growing forever.” Instead, it looked more like an insert-and-prune loop: Codex inserted new rows, then deleted old rows to keep the retained row count stable. The visible file size stayed relatively calm, but the drive still had to process the repeated writes.
A 15-second sample from the report showed the problem clearly:
Metric | Before | After |
Retained rows | 681,774 | 681,774 |
Max row ID | 5,003,347,015 | 5,003,383,226 |
That means about 36,211 rows were inserted in 15 seconds, even though the retained row count did not increase at all. The database looked stable from the outside, but the write churn continued underneath.
The frequent log entries were also not all high-value application events. The examples included repeated filesystem and dependency-level noise such as inotify events:
128,764x TRACE log: inotify event: ... name: Some("ld.so.cache")
37,982x TRACE log: inotify event: ... name: Some("locale.alias")
23,843x TRACE log: inotify event: ... name: Some("passwd")
The result was a local logging system that could keep rewriting storage while giving users very few visible signs that anything unusual was happening.
A 1GB File Can Still Produce Hundreds of Terabytes of Writes
The most counterintuitive part of this incident is simple: SSD wear is about total writes, not the current file size.
A local database can remain around 1GB while the application repeatedly writes, prunes, indexes, checkpoints, and rewrites parts of it. From a storage-health perspective, what matters is not just how large the file looks today. What matters is how much data has been written over time.
The report included one snapshot that made the gap easier to see:
Metric | Value |
Current | 1.2 GiB |
Current retained rows | 506,149 |
Total allocated row IDs | 5,543,677,486 |
The current database kept only about half a million rows, while the auto-incremented row ID had already passed 5.5 billion. That is the core of the write-amplification story: old rows can disappear from the current database view, but the disk writes that created them have already happened.
SQLite’s WAL, or Write-Ahead Logging, also matters here. With WAL mode, changes are appended to a separate -wal file before being checkpointed back into the main database. WAL is a normal and useful SQLite mechanism, but when an application performs very frequent inserts and deletes, it can multiply the amount of disk activity that happens behind the scenes.
In plain language: the notebook still looks thin, but the same pages have been written, erased, and rewritten many times.
Root Cause: A RUST_LOG Setting That Did Not Behave as Users Expected
The report pointed to one especially important configuration detail in the Codex logging path:
Targets::new().with_default(Level::TRACE)In Rust’s tracing ecosystem, log filtering is often controlled through targets and levels. Users may reasonably expect the RUST_LOG environment variable to help reduce log verbosity to something like info, warn, or lower.
But in this path, the SQLite feedback log sink used a default of TRACE. TRACE is the most verbose level, and it can capture low-level dependency details, raw protocol activity, and other debugging noise. The issue report argued that this default meant the local persistent log database kept storing far more than it should.
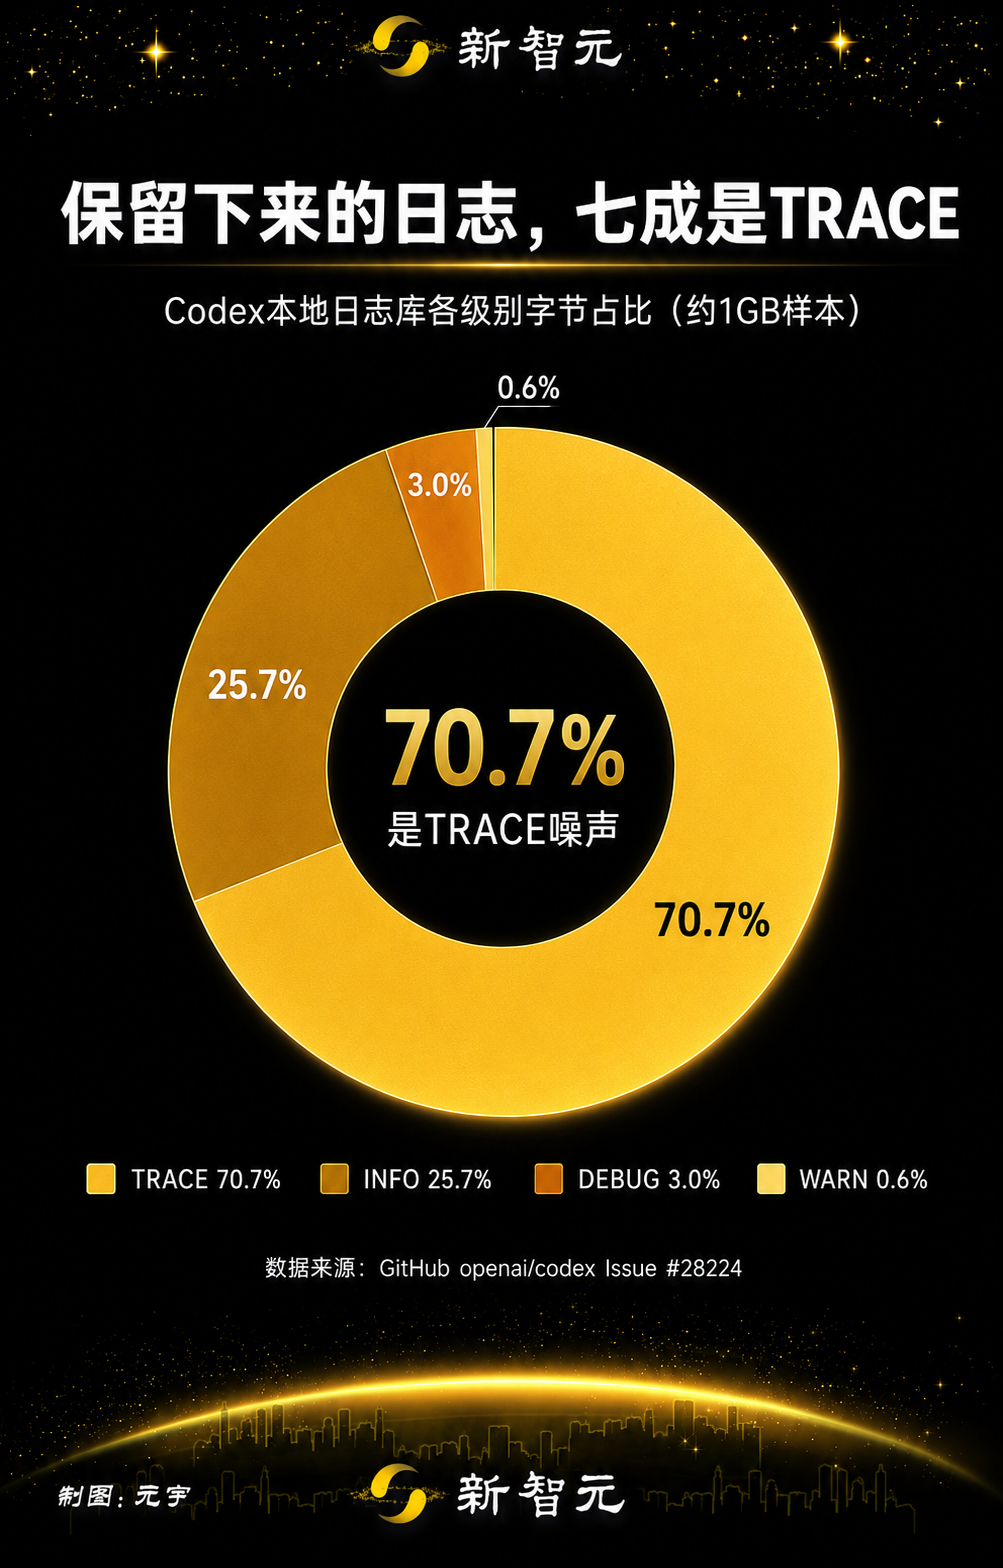
The retained log distribution showed how dominant TRACE-level content was:
Level | Estimated MiB | Byte Share |
TRACE | 732.5 | 70.7% |
INFO | 266.5 | 25.7% |
DEBUG | 30.6 | 3.0% |
WARN | 5.9 | 0.6% |
The report also noted that two mirrored OpenTelemetry-related log sources, codex_otel.log_only and codex_otel.trace_safe, accounted for another large portion of retained log bytes. In that sample, the reporter estimated that filtering these noisy categories could remove most of the retained log volume without fully disabling feedback logs.
That is why the bug felt so frustrating to developers. It was not just “you forgot to configure logging.” It looked more like “you tried to reduce logging, but this path still persisted verbose logs anyway.”
This Was Not the First Related Issue
The report did not treat this as a single isolated accident. It listed a group of related Codex issues around SQLite logs, WAL growth, heavy disk activity, and unbounded or excessive local logging.
Some examples mentioned in the report included:
Issue | Reported Theme |
| Excessive SQLite WAL writes during streaming because TRACE logs ignored |
| Desktop |
| WAL files remaining allocated or growing unexpectedly |
| Feedback log SQLite growth without enough retention or rotation |
| Write amplification on a tiny SQLite database |
| Heavy I/O from idle Codex processes |
| 100% disk active time on Windows / WSL2 |
The bigger lesson is not that SQLite is bad, or that logging is bad. Both are useful. The lesson is that a local agent running for long sessions needs an explicit resource budget.
AI coding tools are increasingly treated like always-on development partners. They read files, watch repositories, keep sessions alive, collect telemetry, and preserve context. That makes local disk, memory, and CPU budgets just as important as token budgets and model quality.
The Fixes Were Merged, But the Debate Did Not End
The GitHub issue later added an update saying that three pull requests had been merged and that the reporter’s own Codex feedback suggested an estimated 85% reduction in logs.
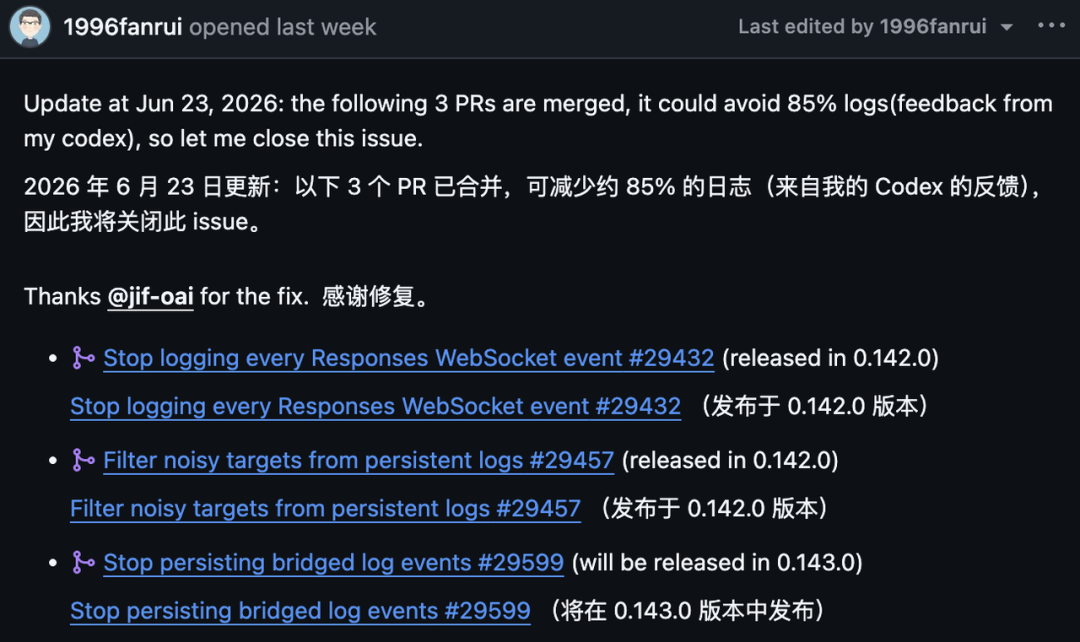
The issue listed the three fixes like this:
Pull Request | Purpose | Release Note in Issue |
| Stop logging every Responses WebSocket event | Released in |
| Filter noisy targets from persistent logs | Released in |
| Stop persisting bridged log events | Planned for |
An 85% reduction is significant, but it is not the same as proving that local logging now has a hard long-term write budget. That distinction is why the discussion continued. Developers were not only asking whether this particular bug had been reduced; they were asking whether AI coding agents should have clearer limits for persistent local telemetry.
The GitHub issue also included a simple workaround shared by a commenter. It blocks inserts into the logs table by creating a SQLite trigger:
sqlite3 ~/.codex/logs_2.sqlite "CREATE TRIGGER IF NOT EXISTS
  block_log_inserts BEFORE INSERT ON logs BEGIN SELECT RAISE(IGNORE);
  END;"
Use workarounds like this carefully. They may reduce local log writes, but they can also remove diagnostic data that support teams or developers might need later. In general, updating to a fixed version and checking the current log behavior is safer than silently modifying an application database without understanding the tradeoff.
The Coding Tool Battle Is Burning More Than SSDs
The discussion quickly moved beyond Codex alone. On Hacker News, developers also brought up broader complaints about AI coding tools: high GPU usage, heavy memory consumption, background activity, and large local debug logs.
That reaction makes sense. Modern AI coding assistants are no longer simple command-line utilities. Many of them behave more like local agents: they watch projects, talk to remote models, manage context, run commands, and keep state across tasks. That power is useful, but it also creates a new category of engineering responsibility.
A tool can feel “fine” in the user interface while still quietly consuming resources in the background. Fast CPUs, large memory, and modern NVMe drives can hide problems for a long time. The app may not freeze. The disk may not fill up. The terminal may still respond. But the hardware health counters can tell a different story.
That is why this incident became a useful case study for AI developer tools. Model capability matters, but local operational quality matters too. A coding agent that lives on a developer’s machine needs sane defaults, retention limits, log rotation, and a way for users to understand what it is doing.
FAQ
What was the Codex SQLite log bug?
It was a reported Codex logging issue where local SQLite feedback logs could generate very large amounts of disk writes. The GitHub report estimated around 640TB of writes per year under the reporter’s measured usage pattern.
Why could a small logs_2.sqlite file still wear an SSD?
SSD endurance depends on total data written over time, not only the current file size. A database can repeatedly insert, delete, write to WAL, checkpoint, and update indexes while still appearing small on disk.
What does SQLite WAL mean in this context?
WAL stands for Write-Ahead Logging. SQLite writes changes to a separate -wal file first and later checkpoints them back into the main database, which is normal behavior but can create a lot of activity when inserts and deletes happen very frequently.
What role did TRACE logging play?
TRACE is the most verbose log level. In the reported sample, TRACE-level content accounted for about 70.7% of retained log bytes, and the issue argued that verbose dependency and protocol logs were being persisted by default.
Did OpenAI fix the Codex logging issue?
The GitHub issue update said three PRs were merged, with the reporter estimating that they could avoid about 85% of logs based on feedback from their Codex usage. Two fixes were listed as released in 0.142.0, while the third was listed as planned for 0.143.0.
Should users delete or block Codex logs manually?
Manual changes should be treated carefully because they can remove diagnostic information and may have side effects. A safer first step is to update Codex, inspect the log files, and monitor SSD write counters if you are concerned.
Is this only a Codex problem?
This specific report focused on Codex. However, the broader concern applies to local AI agents in general: always-on tools need clear resource budgets for disk, CPU, memory, telemetry, and retained logs.
Related Tools
OpenAI Codex GitHub Repository: The public repository for Codex CLI and related source code.
SQLite: The embedded database engine used by many local applications and tools.
SQLite Write-Ahead Logging Documentation: Official documentation explaining how WAL works and why checkpointing matters.
Rust tracing: The Rust structured logging and diagnostics framework discussed in the Codex issue.
smartmontools: A toolset for checking SMART storage health data, including SSD write counters on supported drives.
Hacker News: The discussion platform where the Codex logging report drew broader developer attention.
Related Links
Codex SQLite feedback logs issue #28224: The main GitHub issue documenting the reported 640TB/year write estimate and evidence.
Stop logging every Responses WebSocket event #29432: One of the merged PRs listed as part of the logging reduction work.
Filter noisy targets from persistent logs #29457: The PR focused on filtering noisy persistent logging targets.
Stop persisting bridged log events #29599: The follow-up PR aimed at stopping bridged dependency log events from being persisted.
Hacker News discussion: Community discussion around Codex logging, SSD writes, and AI coding tool quality.
OpenAI Codex CLI README: Official repository README for installing and running Codex CLI.
SQLite WAL documentation: Official explanation of WAL files, checkpoints, and performance considerations.